|
| |
nextnano3 - Tutorial
2D Tutorial
Fock-Darwin states of a 2D parabolic, anisotropic (elliptical) potential in a magnetic field
Author:
Stefan Birner
==> This is the old website:
A new version of this tutorial can be found
here.
 -> 1DGaAs_ParabolicQW_infinite_4_6meV.in

 -> 1DGaAs_ParabolicQW_infinite_6_1meV.in

 -> 2DGaAs_BiParabolicEllipticQD_Austing.in
Fock-Darwin states of a 2D parabolic, anisotropic (elliptical) potential in a magnetic field
In this tutorial we study the electron energy levels of a two-dimensional
parabolic, anisotropic (elliptical) confinement potential
that is subject to a magnetic field.
Such a potential can be constructed by surrounding GaAs with an AlxGa1-xAs
alloy that has a parabolic alloy profile in the x and y directions.
First, it is necessary to study the energy states of a 1D parabolic
confinement.
1D parabolic confinement along the x direction with hbarw0 = 4.6 meV
(1D simulation)
-> 1DGaAs_ParabolicQW_infinite_4_6meV.in
For similar results and a discussion, we refer to this tutorial:
Parabolic Quantum Well (GaAs / AlAs)
1D parabolic confinement along the y direction with hbarw0
= 6.1 meV (1D simulation)
-> 1DGaAs_ParabolicQW_infinite_6_1meV.in
For similar results and a discussion, we refer to this tutorial:
Parabolic Quantum Well (GaAs / AlAs)
First, it is a good idea to get familiar with the results of a 2D parabolic
and isotropic confinement: Fock-Darwin states of a 2D parabolic potential in a magnetic field
Now we turn to the anisotropic confinement...
2D parabolic, anisotropic (elliptical) confinement with hbarwx =
4.6 meV and and hbarwy = 6.1 meV -
Fock-Darwin-like spectrum (2D simulation)
-> 2DGaAs_BiParabolicEllipticQD_Austing.in
- The electron effective mass in GaAs is me* = 0.067 m0.
We assume this value for the effective mass in the whole region (i.e. also
inside the AlGaAs alloy).
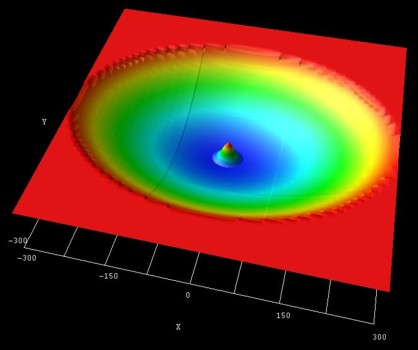
- The following figure shows the parabolic, anisotropic (elliptical) conduction band edge confinement potential,
as well as the ground state wave function (psi2) at B = 0 T.
In
the middle of the sample the conduction band edge is at
0 eV and at the boundary
region the conduction band edge has the value 0.84 eV.
The radii of the ellipse are 300 nm along the x axis and 226 nm along the y
axis.
The parabolic confinement along the x direction is: hbarwx =
4.6 meV
The parabolic confinement along the y direction is: hbarwy =
6.1 meV
Thus the ellipticity is roughly 4/3.
At zero magnetic field, the eigenvalues for such a system are given by:
Enx,ny = (nx + 1/2) hbarwx + (ny +
1/2) hbar wy
nx = n + 1/2 |l| - 1/2 |l|
ny = n + 1/2 |l| + 1/2 |l|
for n = 0,1,2,3,... and l =
0,+-1,+-2,...
(n = radial quantum number, l = angular momentum quantum number, wx
and wy =
oscillator frequencies)
For more details, see A.V. Madhav, T. Chakraborty, Physical Review B 49,
8163 (1994).
The eigenvalue spectrum of a 2D parabolic and isotropic
potential shows a shell-like structure:
Energy levels of an "artificial atom" - 2D harmonic potential
For the anisotropic elliptical potential, this degeneracy at B
= 0 T is lifted.
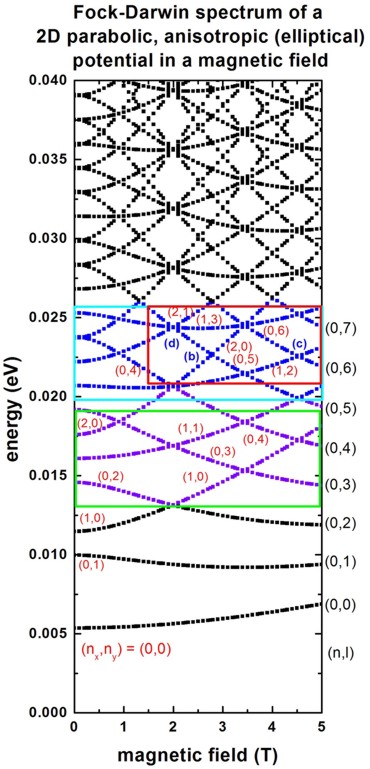
The following figure shows the calculated Fock-Darwin-like spectrum, i.e. the eigenstates as a function of magnetic field magnitude.
Here, each of these states is two-fold spin-degenerate. However, a magnetic
field lifts this degeneracy (Zeeman splitting) but this effect is not taking into account
in this tutorial.
- Such a spectrum can be related to experimental transport measurements
which
give insight into the single-particle energy spectrum of a quantum dot.
The rectangles in the above figure are related to the figures of the
following publications:
cyan rectangle: Fig. 2 of
Two-level anti-crossings high up in the
single-particle energy spectrum of a quantum dot
C. Payette, D.G. Austing, G. Yu, J.A. Gupta,
S.V. Nair, B. Partoens, S. Amaha, S. Tarucha
arXiv:0710.1035v1
[cond-mat.mes-hall] (2007)
green rectangle: Fig. 2(b) of
red rectangle: Fig. 3(a) of
Probing by transport the single-particle energy
spectrum up to high energy of
one quantum dot with the ground state of an adjacent
weakly coupled quantum dot
D.G. Austing, G. Yu, C. Payette, J.A. Gupta, M.
Korkusinski, G.C. Aers
physica status solidi (a), 508 (2007)
(Comments red rectangle: In Fig. 3(a) of
the publication by Austing et al., the ground state energy has been
subtracted from the excited states. Thus the slope of the energy spectrum
look slightly different.)
It is interesting to note that there are exact crossings in the calculated spectrum
whereas the experiment reveals anti-crossings.
|